Source: centralsan.org
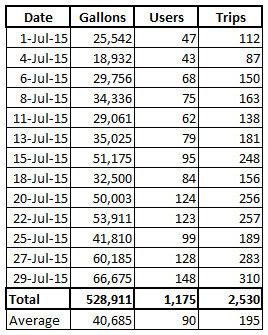
We’re near the end of another month and people like stats, especially when we’re talking big numbers. Between longer hours, better traffic control and a more efficient way to track fill station usage, CCCSD sure has come a long way from the beginning. Just two weeks ago, if you asked for a data set you could get it that day, but the data was old. Data entry was making the entire process very inefficient.
When the fill station started, expectations were low so all data entry occurred on paper. Up until about the middle of July, everything was done by hand. Now that they’ve written some custom software and acquired a drivers license scanner, data is available in 15 minute increments. Yes, once they get enough data they will know when the busy and slow times are. 🙂
The data charts I received are up to July 28th, 2015. I’ll post the graphics they create, plus some analysis.
Total gallons served: 4,313,000
Continue reading
 Another month has been completed and lots of changes. Plenty of new fill stations have come online (3 new ones in SoCal!), lots of activity on Twitter (new followers, retweets & favorites) and a Wastewater Treatment Plant in Southern California made graphics for an article I posted.


 Lots of activity this time around. The twitter handle
