After my recent post about usage stats from CCCSD, I figured it would be only fair to see if the other area Residential Recycled Water Fill Stations posted data of their own. The only other district to do so is Ironhouse Sanitary District in Oakley.
Ironhouse Sanitary District has their own website where they blog about news and updates for their Residential Recycled Water Fill Station. You can access it here: http://isdfillstation.blogspot.com/
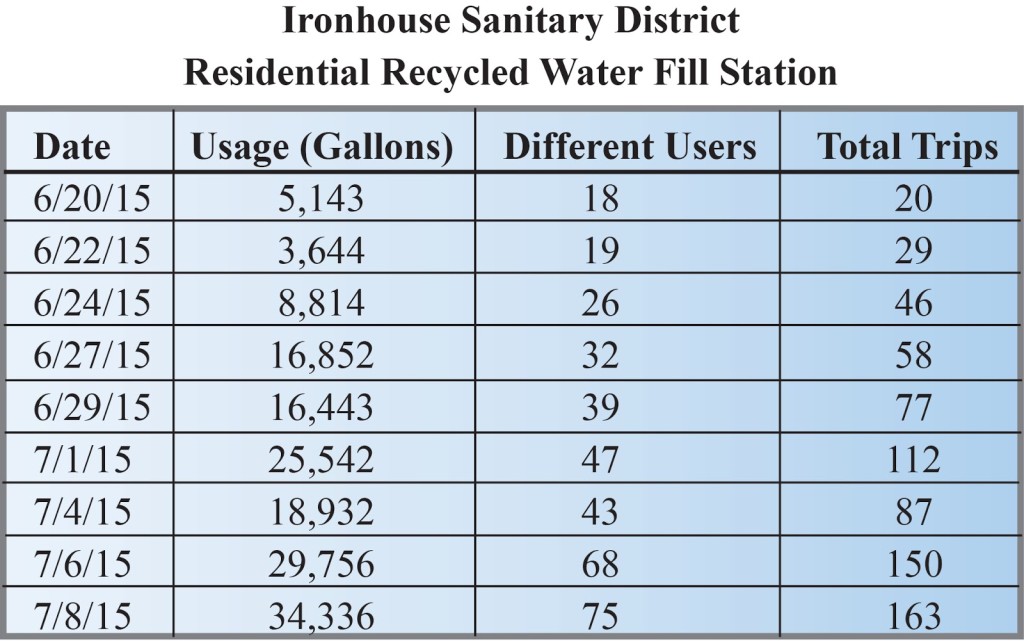
On Friday, July 10th, they published their Residential Recycled Water Fill Station stats dating back from June 20th, 2015 up to July 8th, 2015.
Using the provided numbers, I created some usage statistics for them.
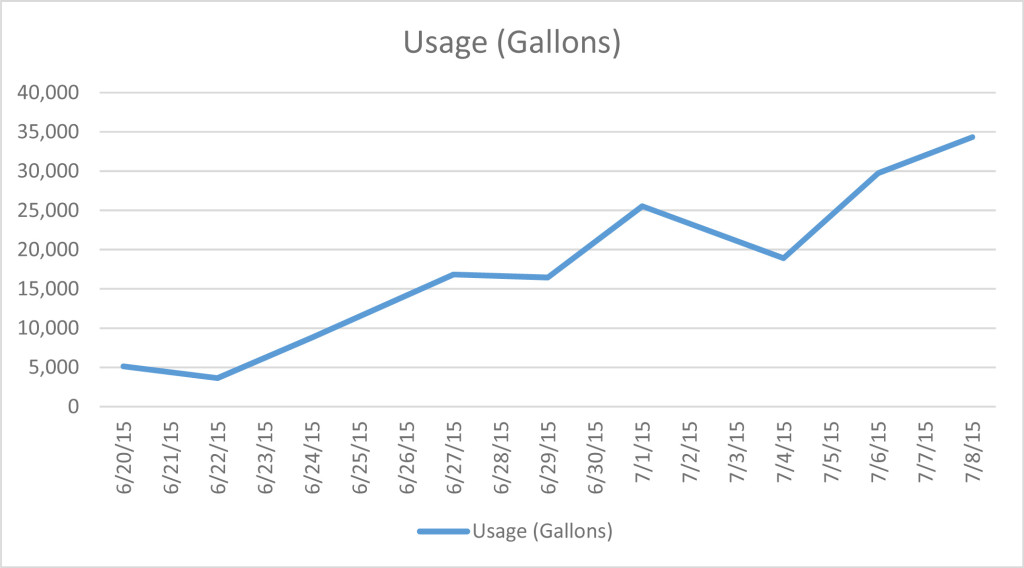
Usage (Gallons)
In the 9 days that Ironhouse Sanitary District’s fill station has been open, they have given away 159,462 gallons of recycled water.
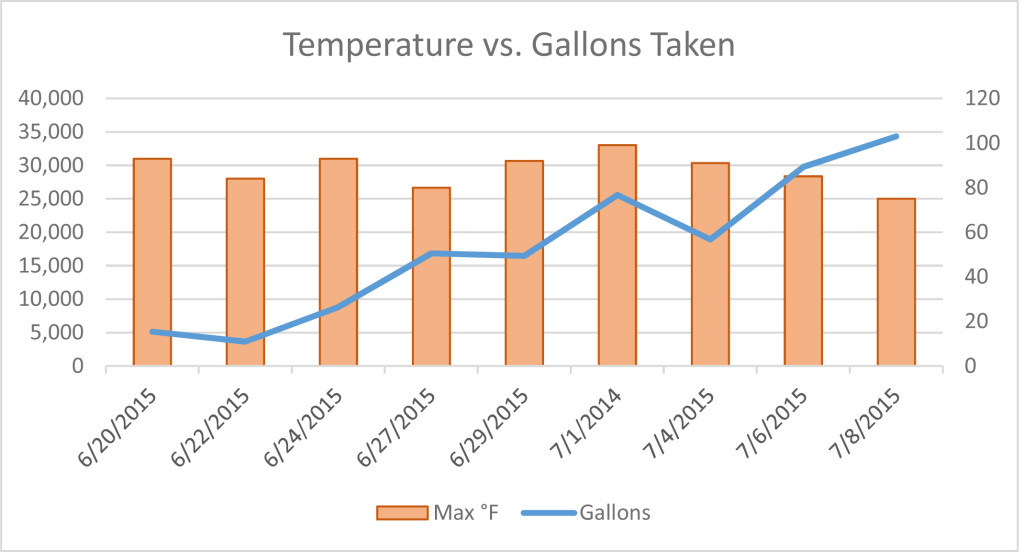
Temperature Compared to Gallons Taken
Does a rise in temperature mean more water is taken, or is the fill station too new to have an impact? Looks like as the weather is hotter, more water is generally taken. So yes, weather does impact water usage, as apparent in the very beginning, but it is probably too soon to tell as the number of users also is on the rise.
Historical Temperatures provided by http://www.wunderground.com/history
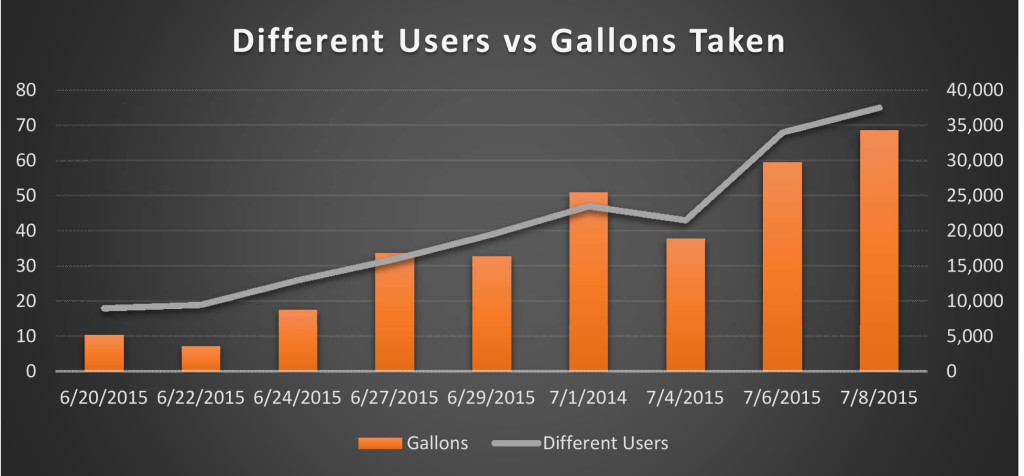
Different Users vs Gallons Taken
In the beginning of the period, number of users went up but their volume taken initially dropped. We’ll see the trend show as more users show up, more water is taken.
Honestly, I like the color charts and wish my stock portfolio trended like this. 😉
I didn’t create charts for this next, but the data I used is at the bottom of the page.
Averages
Most fill station users will make an average of 2 trips per day.
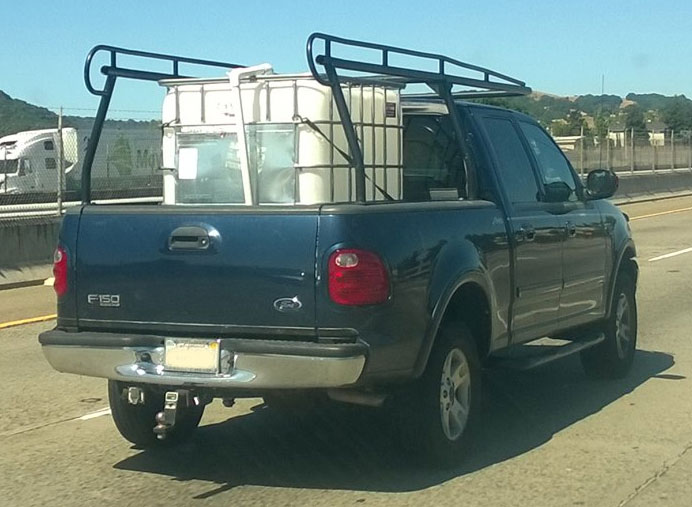
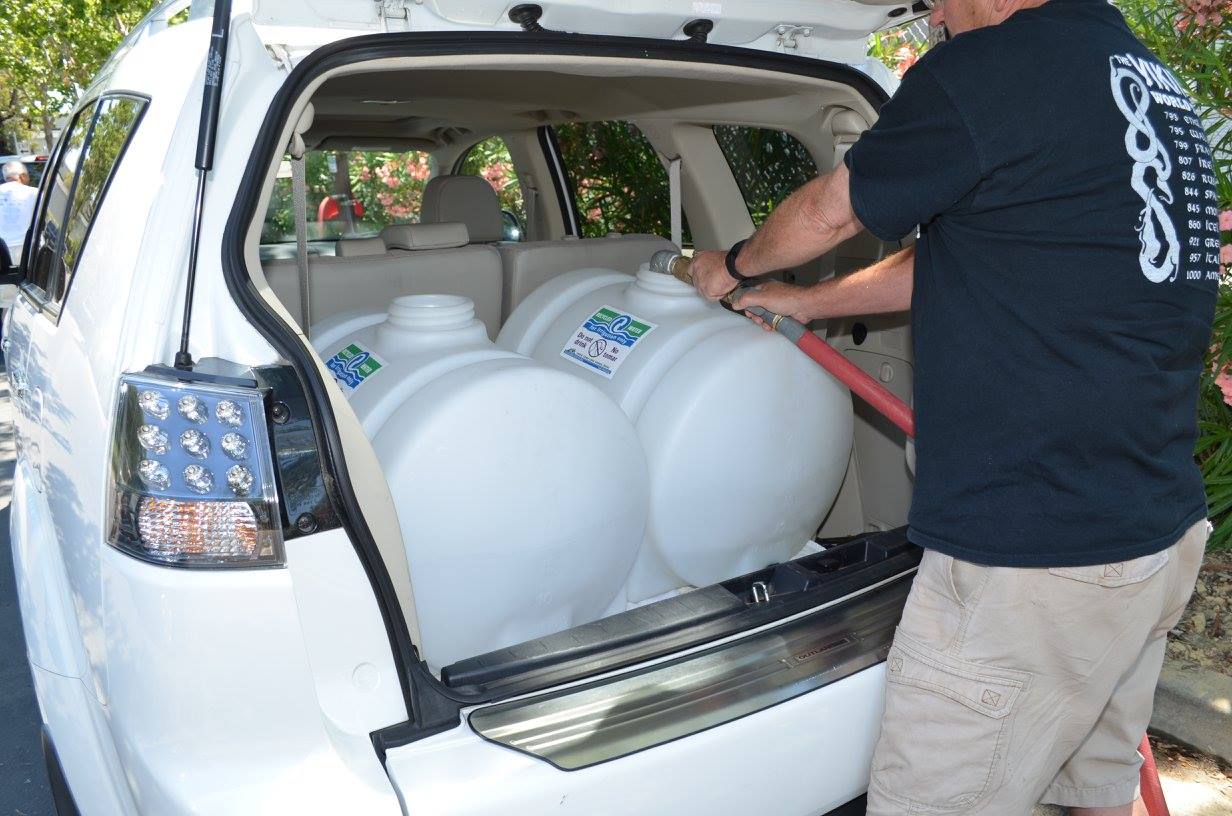
The average gallons per trip taken is 215 gallons. Slightly less than a 275 gallon tote, but I’m sure this is from a mix of totes and barrels.
They need to so they can take home about 400 gallons total. Perhaps it would better to just raise their take home limits to 400, if they sign a liability waiver that says they understand the risks associated with driving with 3,336 pounds of water. It just might work.
You’re welcome to dig into this more if you would like. Below is the chart I made from their data graphic with a little data analysis also.
Happy Monday!



Leave a Reply